sábado, 3 de fevereiro de 2018

sexta-feira, 2 de fevereiro de 2018

Management and the wealth of nations

A 15-year survey of 12,000 firms across 34 countries shows that management practices explain a large share of productivity gaps

Income differences between rich and poor countries remain staggering, and these inequalities are in good part due to unexplained productivity gaps (what economists call total factor productivity, or TFP for short). Many estimates (e.g. Jones 2015) calculate that US productivity is more than 30 times larger than some sub-Saharan African countries. In practical terms, this means it would take a Liberian worker a month to produce what an American worker makes in a day, even if they had access to the same capital equipment and materials.

This huge productivity spread between countries is mirrored by large productivity differences within countries. Output per worker is four times as great, and TFP twice as large, for the top 10% of US establishments compared to the bottom 10%, even within a narrowly defined industry like cement or cardboard box production (Syverson 2011). And such cross-firm differences appear even greater for developing countries (Hsieh and Klenow 2009).

Core management practices

The importance of core management practices for such between-country and between-firm performance spreads has long been recognised, from Adam Smith’s 1776 pin factory, through Francis Walker (the founder of the American Economic Association in 1887), to today’s large community of management scholars.

Many case studies illustrate the importance of management. For example, one I was involved with was Gokaldas Exports (Bloom et al. 2013), a family-owned business founded in 1979 that had grown into India’s largest apparel exporter by 2004. It had 35,000 workers, was valued at approximately $215 million, and exported nearly 90% of its production. Its founder, Jhamandas H Hinduja, had bequeathed control of the company to three sons, each of whom brought in his own son. Nike, a major customer, wanted Gokaldas to introduce lean management practices and put the company in touch with consultants who could help to make this happen. But the CEO was resistant. It took rising competition from Bangladesh, multiple demonstration projects, and finally the intervention of other family members (one of whom I taught in business school) to overcome this resistance. The new practices led to greatly enhanced performance.

Such anecdotes suggest that management is an important driver of productivity, and further raise the question of why – if management is so critical – is change so challenging? However, many remain sceptical. Are such case studies really generalisable? The statistical study of management practices has been inhibited by a lack of large-scale, quantitative data across many firms, industries, and countries. In the past 15 years, I have helped develop new ways of robustly measuring management practices and can now show that a large fraction of productivity differences is due to the adoption of those practices.

World Management Survey

Our first attempt has been the World Management Survey. This now covers 12,000 organisations across 34 countries that use (or don’t use) core management practices, such as setting sensible targets, providing proper incentives, and credibly monitoring performance (Bloom and Van Reenen 2007, Bloom et al. 2017). With this instrument, we rated companies on their use of 18 practices, ranging from poor to non-existent at the low end (for example, “performance measures tracked do not indicate directly if overall business objectives are being met”) to very sophisticated at the high end (“performance is continuously tracked and communicated, both formally and informally, to all staff using a range of visual management tools”). When we started working on this project back in 2002, our aim was to build a dataset that had two key features. First, the data had to be reliable and fully comparable across firms. Second, the data had to cover a large and representative sample of firms around the world. We quickly realised that in order to achieve our goals we had to manage the data collection process ourselves, with the help of a large team of interviewers conducting phone interviews from the London School of Economics, where we were all based at the time. We were able to make many methodological choices in terms of how the data were collected – such as having multiple interviews per firm with different interviewers – which reassure us that the data provides a very realistic perspective of the extent to which the core management practices included in the survey were actually adopted.

Variation across firms and between countries

Figure 1 Average management scores by country


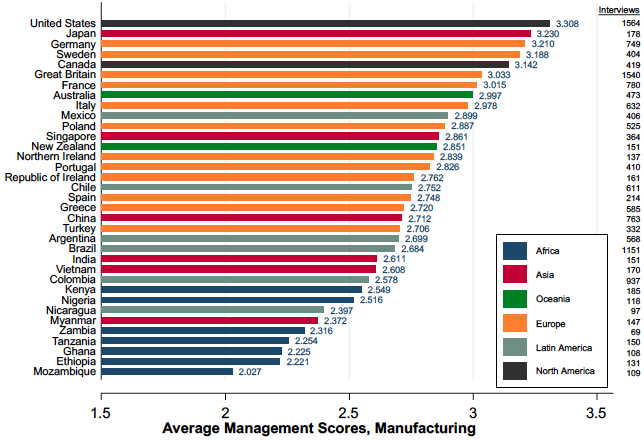
Note: Average management scores; 15,489 observations (2004-2014).
Source: Bloom et al. (2017)

The dispersion in the management score across firms is large. Figure 1 shows that there are large between country differences that largely mirror the productivity spread. An even larger fraction of the overall variance (approximately 40%) is actually within countries across different firms (Figure 2). Across our entire sample we find that 11% of firms have an average score of two or less, which corresponds to very weak monitoring, almost no targets for employees, and promotions and rewards based on tenure or family connections. At the other end of the spectrum, there are also clear management superstars across all the countries we surveyed – 6% of the firms in our sample have a score of four or greater. In other words, such firms boast rigorous performance monitoring, systems geared to optimise the flow of information across and within functions, motivational short- and long-run targets, and a performance system that rewards and promotes great employees while helping underperformers to turn around or move on.

Figure 2 Management practice scores across firms


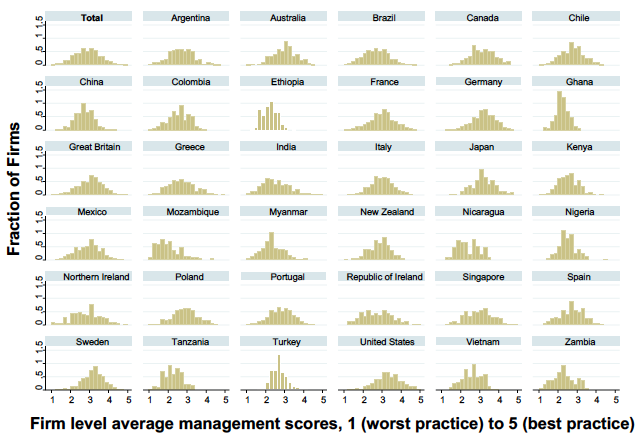
Note: Bars are the histogram of the actual density.
Source: Bloom et al. (2017)

The large, persistent gaps in basic managerial practices that we document are associated with large, persistent differences in firm performance. Better-managed firms are more productive, grow at a faster pace, and are less likely to die. Figure 3 shows a close correlation between better-managed firms and higher productivity. This may not be causal of course, but we also observe these performance improvements after experimental interventions ‘injecting’ these type of management practices into Indian textile firms (Bloom et al. 2013).

We performed a simple accounting exercise to evaluate the importance of management for the cross-country differences in productivity. We found that management accounted for about 30% of the unexplained TFP differentials driving the large differences in the wealth of nations.

Figure 3 Firm TFP is increasing in management


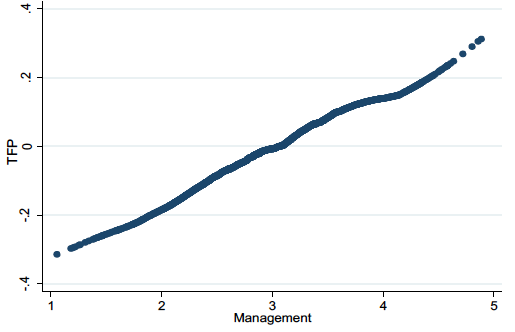
Notes: This plots the lowest predicted valued of TFP against management (bandwidth=0.5). TFP calculated as residual of regression of ln(sales) on ln(capital) and ln(labor) plus a full set of 3 digit industry, country and year dummies controls. N = 10,900.
Source: Bloom et al. (2017)

Concluding remarks

The variation in management is in part due to policy-related factors, starting with competition, which creates a strong incentive to reduce inefficiencies. We have also studied the role of labour regulations, as they may dampen the incentive to adopt practices requiring the flexibility to reallocate employees according to their merit, and to adopt performance-related forms of compensation. Policies aimed at improving the skills, or accelerating the entry or selection of firms based on their managerial capabilities, should certainly be in every policymaker’s playbook.

Finally, information may be critical. As our Gokaldas case study mentioned above illustrated, many firms in developing countries may not even realise how weak their management practices are. Or, even when they do they realise this, they may not know how to improve things. Tools such as benchmarking and training can help spread information and knowledge in both of these dimensions. Governments and NGOs often do this, but such programmes are rarely evaluated in a rigorous way (for a survey, see McKenzie and Woodruff 2017). Doing so may be able to raise management and ultimately the wealth of emerging nations.

References

Bloom, N and J Van Reenen (2007), “Measuring and explaining management practices across firms and countries”, Quarterly Journal of Economics 122(4): 1341-1408.
Bloom, N, S Melvin and J Van Reenen (2013), “Gokaldas Exports (A): The challenge of change”, Stanford Business School Case Study SM-213(A).
Bloom, N, B Eifert, A Mahajan, D McKenzie and J Roberts (2013), “Does management matter? Evidence from India” Quarterly Journal of Economics 128(1): 1-51.
Bloom, N, R Sadun and J Van Reenen (2017), “Management as a technology”, CEP Discussion Paper 1433.
Hsieh, C-T and P Klenow (2009), “Misallocation and manufacturing TFP in China and India”, Quarterly Journal of Economics 124(4): 1403-1448.
Jones, C (2015), “The facts of economic growth”, Chapter 2 in J Taylor and H Uhlig (eds), Handbook of Macroeconomics, Volume 2A, North Holland.
McKenzie, D and C Woodruff (2017), “Business practices in small firms in developing countries”, Management Science 63(9): 2967-2981.
Syverson, C (2011), “What determines productivity?” Journal of Economic Literature 49(2): 326-65.

Originalmente publicado em https://voxdev.org/topic/firms-trade/management-and-wealth-nations

quinta-feira, 1 de fevereiro de 2018

WINIR Conference on "Institutions & The Future of Global Capitalism", Hong Kong, 14-17 Sept 2018

The twenty-first century will see major disruptions to the global balance of politico-economic power. China will soon become the world’s largest economy; India is another rising giant. These and other developments – including growing inequality in several major economies – contest the Western institutional model of economic development and mount new institutional challenges at the global level. There is a recognised need for new or enhanced international orders, to sustain peace and international trade, as well as to address the problem of climate change. Meanwhile, an extended period of global integration has fuelled local discontent and led to a rise of nationalism and separatism. The international challenges of the twenty-first century place institutional development and reform at the top of the agenda.
Organised in collaboration with the Faculty of Law of the Chinese University of Hong Kong (CUHK), the Fifth WINIR Conference will explore these institutional challenges. Contributions from any academic discipline or theoretical approach that address the challenges and dynamics of the economic, political, legal and social institutions of our time are welcome. Submissions on other aspects of institutional research are also welcome, with preference to those that relate to WINIR’s aims and research priorities.
The conference will open on the afternoon of Friday 14 September 2018 and end with a dinner on the evening of Sunday 16 September. Delegates will depart on Monday 17 September. The Friday sessions will be held on the CUHK's attractive campus in the New Territories district. On Saturday and Sunday the conference will be held in the heart of the Central district of Hong Kong.
Keynotes lectures will be given by:
Xu Chenggang (University of Hong Kong) 
Justin Yifu Lin (National School of Development) 
Linda Weiss (University of Sydney)
All abstract submissions must be in English, but on this occasion presenters will be allowed to present their papers in English or Chinese. Chinese- and English-speaking streams will run in parallel in the breakout sessions. Authors wishing to present their paper in Chinese must indicate this during the online abstract submission process.

 
Submissions (300 words max.) will be evaluated be evaluated by the WINIR Scientific Quality Committee: Bas van Bavel (Utrecht University, history), Simon Deakin (University of Cambridge, law), Geoff Hodgson (University of Hertfordshire, economics), Uskali Mäki (University of Helsinki, philosophy), Katharina Pistor (Columbia Law School, law), Sven Steinmo (European Univeristy Institute, politics), Wolfgang Streeck (Max Planck Institute Cologne, sociology), Linda Weiss (University of Sydney, politics).

Please note the following important dates:
10 March 2018 - Abstract submission deadline
24 March 2018  - Notification of acceptance
31 March 2018  - Registration opens
15 May 2018  - Early registration deadline
31 July 2018  - Registration deadline for accepted authors
1 August 2018 - Non-registered authors removed from programme
15 August 2018  - Registration deadline for non-presenters
16 August 2018 - Late surcharge for non-presenters applies
1 September 2018 - Full paper submission deadline
We look forward to receiving your submission.
More information at www.winir.org

quarta-feira, 31 de janeiro de 2018

33 routes to open innovation

BY  JAN SPRUIJT, 3 MONTHS AGO , UNDER FEATUREDGENERAL

It has been a while since Henry Chesbrough coined the term Open Innovation and formulated it’s definition: “combining internal and external ideas as well as internal and external paths to market to advance the development of new technologies.” (Chesbrough, 2003). In the course of time, the terminology surrounding Open Innovation has evolved alongside developments in management literature and practises. Open Innovation as a paradigm on itself is on its quest to touch base. Rather than taking a (technical) process-oriented approach, Open Innovation is now also about Open Business Models (Chesbrough, 2006), Open Services (Chesbrough, 2010) – both from a more strategic perspective – and practical tools (Vanhaverbeeke, 2017) – more from a tactical or operational point-of-view.

While it could be argued if Open Innovation is the best approach to be used as a general framework to put different strategic, tactical and operational activities into perspective, it is useful to try. So that’s what I did below: I used to initial Open Innovation framework, based on the innovation funnel, to describe and position a long, but non-exclusive, list of activities that are related to Open Innovation. Of course, also other frameworks could be used to do so, but this seemed like a solid approach.
The infographic includes 33 routes to Open Innovation, ordened by:
  • the level of involvement of partners (upper half) and clients (lower half): the closer the activity is to the funnel, the more involvement is required to succeed.
  • The size of the circles are partly intuitive, partly evidence-based, and describe to current usage of the phenomenen or in some cases the current impact of the phenomomen.
  • Also note that some of the ‘activities’ are rather ‘systems’ that could be tapped into to use it as a source of innovation in stead of an activity that you’ll have to organize and accelerate yourself.

Tekengebied 1@36x-80.jpg
Click image to download full resolution copy.

The goal of this framework: to give you an idea of all the possibilities that come with Open Innovation, where you could start and in what stage of your internal process it comes in (most) handy.

Partner Activities:

Route 1: In-licensing

The process of sourcing for external knowledge, patents or technology and to formalize the use of that information in your own innovation process. The ‘license’ often include information about the collaborators, how the risks are shared, how the pofits are shared and to what extend the technology or information may or may not be altered or adapted.

Route 2: Co-patenting

The process of collaboration between inventors and joined registration for a patent that may be used for further exploration and exploitation onwards. The effect has been studied by for instance Belderbos and it also an indication of the strength of (inter)regional collaboration, according to OECD.

Route 3: Spin-off

A spin-off is a form of Open Innovation in the sense that a company can ‘spin-off’ a newly developed technology to the public market for further exploitation by the involved engineers or startup team. It thus a technique to split off an early innovation in the hope that, when it leaves it mother’s wings, it will become more successfull on his own.

Route 4: Collaborative Innovation

Collaborative Innovation is a branche within Open Innovation that studies the effect of temporary Open Innovation-projects with a single goal in mind, such as the creation of a new product or the development of a new service. It is as such not a paradigm but a program management method. Vareska van de Vrande was recently appointed as professor of Collaborative Innovation at the Rotterdam School of Business.

Route 5: Co-engineering

Collaborative engineering: a term mainly used in conventional manufacturing and production industry, with a focus on collaboration between two or more partners in the full process of design, engineering and manufacturing with multidisciplinary teams and supply chain integration.

Route 6: Co-learning

A different approach to open innovation because it is more about HRM and than about the processes itself that become open. Co-learning is about the collaborative learning platforms or trajectories for personnel in order to gain new skills, both on operational level as on more tactical or strategic levels. The knowledge than flows back into the company making the influx of knowledge applicable to business processes. For instance: Faems (2006) and Rowley, Kupiec-Teahan and Leeman (1983)

Route 7: Spin-out

A spin-out differs from a spin-off in the sense that the technology or startup-team is moving to another ‘mothership’ in the form of an acquisition, merger or (most likely, because the former two usually don’t happen at this early stage) a joint venture.

Route 8: Open Innovation-based Business Models

Basically, this is about having a business model in place that exploits the opportunities that arise because of Open Innovation. Businesses with Open Innovation-based Business Models usually are trying to take the place of innovation intermediaries in Open Innovation networks. They can for instance be inventors with the sole purpose of registering and selling intellectual property. Or they can be network brokers. More information in Weiblen (2014) and Chesbrough (2010) when he describes these companies as merchants.

Route 9: Out-licensing

Out-licensing is one of the most important strategies within Outbound Open Innovation. Outbound Open Innovation is a core principle of the Open Innovation Paradigm and includes for instance also spin-offs and spin-outs. Out-licensing explores gainin external rewards for internally developped technologies. More information: Lichtenthaler (2009)

Route 10: Co-design

This approach could also have been placed underneath the funnel: co-design usually happens with both partners and customers and is meant to have a more human-centered design approach in your R&D-funnel. It has become a main topic of research within design thinking. More info: Steen, Manschot & De Koning (2011).

Route 11: Open Business Models

Open Business Models are all-inclusive approaches to Open Innovation: “Open Business Models take a broad perspective of ‘resources’ that are exchanged and shared with the ecosystem. […] It is seen as an ecoystem-aware way of value-creation and capturing. (Weiblen, 2014). As such, firms with an Open Business Model collaborate with its ecoystem by building up partner-networks, platforms. The process of ‘opening up the business model’ is often referred to as Business Model Innovation.

Route 12: Open Business

Although the term is almost the same as the before-mentioned approach, ‘Open Business‘ is something completely different. An Open Business embeds a business model that aims to publicly share all data and information. It is related to open source, freeware and open science. 

Route 13: Co-branding

Collaborative branding refers to the fact that a network of organizations join to create a synergetic branding effect. In many case they will create a joint brand that replaces the current product or company brand in order to gain a larger scale effect of the brand. This process is very common in public networks (such as Brainport, the Netherlands, were many companies use the brand Brainport rather than there own branding), but also works out for business-only partnerships, such as the Douwe Egberts and Philips co-brand Senseo. A related term is co-promotion.

Route 14: Co-production

Co-production – or co-manufacturing – is largely the same as co-engineering except from the fact that it focuses only the production part of the process, thus enhancing economies of scale and cost reductions in (mass) production environments.

Route 15: Co-marketing

Co-marketing, like co-branding, is about creating a synergetic effect in the commercialization stage of the innovation process. Collaborative marketing focuses on sharing distribution channels and pricing information. It involves joint teams of marketeers bringing to market different products from differnt companies.

Partner systems:

Route 16: Sectoral Innovation Systems

A sectoral innovation systems describes the complete institutional environment, whose aim is to accelerate innovation and employability in a certain sector. In the EU, sectoral innovation systems have been a main focus point of both international and national programs over the last two decades. It’s effects still have to be proven.

Route 17: Shared Facilities

The availability of facilities that can be used by networks of companies. From an inbound approach, a company could make use of machine labs, printing labs or hubs with design and production lines; from an outbound approach, companies could share their facilities with others. It contributes to Open Innovation because of the fact that when using these shared facilities, often new combinations or ideas arise. An example of a shared facility is the Holst Centre in Eindhoven.

Route 18: Regional Innovation Systems

A regional innovation describes the institional environment, whose aim is to accelerate innovation and employability in a certain (geographically bounded) region. An example is Brainport. I’ve previously written about regional innovation systems.

Route 19: Business Ecosystems

These are ecosystems that are created and driven by businesses. Another term would be clusters. While business ecosystems are more likely to be created because of commercial opportunities (and as thus may be actually quite ‘closed’ and could prevend Open Innovation from happening), they could also be created with the purpose of Open Innovation in mind. 

Route 20: National Innovation Systems

Same as regional, but than national 😉

Route 21: Fieldlabs

Field Labs are collaborative working places where businesses and knowledge institutes meet to create and develop new ideas. It’s primarily a place where students can work with professionals to create new products. 

Customer activities:

Route 22: Crowdsourcing

The activity of ‘sourcing’ the crowd: gather opinions, ideas, drafts, suggestions and information from the general public, sometimes – but not always – targeted to specific crowds, such as your current customers or users, a group of elite users or targets platforms (such as designers). Crowdsourcing is effective in the early stages of an innovation process because of the fact that it per definition a diverging activity and it results in a wide variety of options to choose from. The technique is not focused enough to be of use later on in the process. Be aware of having enough resourses avaiable when starting a crowdsourcing campaign, as it may go viral and require lots of hours to manage and react. As it is a form of ‘brainstorming’, the general rules of ‘brainstorming’ also apply to crowdsourcing, which includes taking every idea or opinion seriously. 

Route 23: Crowdfunding

Based on the popularity of crowdsourcing, crowdfunding was firstly introduced in the beginning of the 21st century in the US. Its principles are the same, but the main ‘source’ you’re looking for is not ideas or opinions, but finance for your project. Crowdfunding platforms, just like crowdsourcing platforms, deal with intellectual property rights, commons and other legal issues that come into play when dealing with using external work for your project. Crowdfunding is a hugely popular technique but has very low success rates, because of the lower entry barrier. 

Route 24: Open Data

This is more a philosophy than a concrete activity, but at least it is fair to say that the process of opening up your data and tapping into open data is an activity. Increasingly popular in software industry, public institutes and educational institutes, opening up (big) data creates opportunities for organizations that otherwise wouldn’t be able to see and use that data. Searching for and using open data is an effective and efficient Open Innovation tool. Wikipedia states, although it misses a source, that “Some make the case that opening up official information can support technological innovation and economic growth by enabling third parties to develop new kinds of digital applications and services.”

Route 25: Co-creation Labs

Co-creation labs are almost identical to Fieldlabs, except from the fact that co-creation labs are mainly intended for the public to participate (customers, local civilians, et cetera). Co-creation labs are an effective way to gather feedback on newly developed prototypes and get ideas regarding branding and marketing.

Route 26: Co-creation

The term of co-creation is used for a whole lot of different purposes, but in the context of Open Innovation is points to the fact that organizations deliberately seek contact with end customers to test and validate new ideas and prototypes and to gather new ideas for bringing the product to market. Although not intended as such, co-creation, if done right, is also an accepted marketing technique: it engages customers with your product.

Route 27: Community

Communities are groups of highly engaged customers, usually voluntarily involved with your product because of personal interest. Searching for and collaborating with these communities may increase new ideas. Lee et al (2011) argue that communities in the example of Lego, have an automatic filtering, for instance through fora, of ideas and these ideas are as such much more worth looking at than for instance ideas generated by crowdsourcing.

Route 28: E-Participation

Primarily a public or governmental activity, e-participation tries to involve the public in (usually) gathering feedback on delivered services. It also works for companies because gathering feedback helps in validating and incrementally increasing the quality of products. 

Route 29: Open Source

Much related to Open Data, Open Source is a philosophy adopted by software engineers to generate sources codes that are freely available. This doesn’t mean that there isn’t any commercial activity involved: while the source code may be open to the public for use, only developers will understand it – and thus commercial activities can be exploited when making the software available for the public. Examples of Open Source projects are Wikipedia and WordPress. 

Customer systems:

Route 30: Co-working spaces

Increasingly popular, mainly because of the growing number of freelancers and self-employed personal, co-working spaces are actually an excellent place to start networking and source for new ideas. Because of the diversity of specialists working in those places, you are more likely to gather diverse ideas, which work best in the early stages of the inonvation process. In cities such as Amsterdam co-working spaces pop-up all the time, so it’s worth to search for a space that is as diverse as possible and offers also opportunities to chat and discuss. 

Route 31: Collective Intelligence

This is the fundamental construct behind crowdsourcing: the idea is that the ‘collective intelligence’ always outperforms individual intelligence, even of the most awarded geniuses in your expertise. Tapping into the collective intelligence is therefore a useful activity.

Route 32: Smart Cities

The concept of Smart Cities is based around the ICT-perspective on ‘intelligence’: a highly digital, hyperconnected accessible information society in which broadband is present and the main industry focuses on services and online activities. Smart Cities are a cosmopolitan view on the world, but being located in one of them opens up a wide range of opportunities for innovation. 

Route 33: User Engagement

The last route to Open Innovation focuses on the end users of your product or service. User engagement is widely researched as a highly effective approach to Open Innovation. This involves (creative) user research (Kumar) and Lead User Involvement (Bogers). 
I’m quite sure there are many more techniques. Please feel free to add them and to indicate how to could be included in the graphic and I’ll update it.
Publicado originalmente em http://www.openinnovation.eu/11-10-2017/33-routes-to-open-innovation/

segunda-feira, 29 de janeiro de 2018

Identificando o potencial de inovação dos pesquisadores a partir dos dados do CV Lattes

Com as rápidas e constantes transformações na era do conhecimento, cada vez mais se faz necessário o uso de tecnologias e metodologias que possibilitem que o conhecimento possa ser utilizado de forma estratégica para a tomada de decisões nas organizações.
Neste contexto o pesquisador da UTFPR, Silvestre Labiak Jr., doutor em Engenharia e Gestão do Conhecimento, no artigo “Indicadores Indiretos de Inovação”, que conta com a coautoria do Dr. Roberto Carlos dos Santos Pacheco, do MSc. Marcos Luiz Marchezan e da MSc. Viviane Schneider, defende que a inovação é um “elemento para o desenvolvimento competitivo das nações, que exige estudos para quantificar e mapear o potencial de ciência, tecnologia e inovação (CT&I) dos países”.
Como esta quantificação é complexa e requer aferições em muitas dimensões variáveis, os autores do artigo mencionam acreditar que até o momento “nenhum grupo ideal de variáveis de CT&I foi desenvolvido” e que “em muitos casos, indicadores multidimensionais têm sido utilizados, porém ainda assim são contestados por muitos pesquisadores”.
O trabalho dos autores foca na dimensão de inovação relacionada com o capital humano / pesquisador (ativo de conhecimento), envolvido no seu desenvolvimento de criação, uma vez que se considera que os recursos humanos são fundamentais para o desenvolvimento do processo de pesquisa, desenvolvimento e inovação (PD&I).
Conforme citam os pesquisadores, o estudo apresentado procura “identificar quais os ativos de conhecimento das universidades, institutos federais e centros de pesquisa brasileiras que possuem maior potencial para a evolução de inovações, de forma a contribuir para a diminuição da complexidade de análise do potencial de inovação nas instituições, principalmente na comparação entre múltiplos indicadores de inovação que necessitam de estatísticas recorrentemente divergentes”.
Os deixam claro que o não pretendem “desenvolver um modelo que parametrize a CT&I brasileira, mas sim estabelecer parâmetros que possam contribuir na identificação do capital humano (ativos de conhecimento) com maior potencial inovador se comparado com seus pares, a partir de dados auto declaráveis, pertencentes a base comum do Currículo Lattes”.
Desta forma, argumentam os autores, que a introdução destes indicadores procura “facilitar a estruturação de redes de ativos de conhecimento com potencial de inovação, que possam ser identificados com o apoio de ferramentas/sistemas de engenharia do conhecimento, tais como a plataforma tecnológica Stela Experta®, que possibilita o mapeamento dos ativos de conhecimento das ICTs (Instituições de Ciência e Tecnologia)”.

A proposta do modelo de indicadores do potencial de inovação a partir dos dados do Currículo Lattes

Os indicadores de inovação são, muitas vezes, indiretos, já que eles correspondem a “fenômenos subjacentes, intangíveis e diretamente observáveis” segundo o artigo de Labiak Jr., Pacheco, Marchezan e Schneider.
Na construção do modelo os autores do artigo utilizaram análises estatísticas para definir os pesos relativos aos indicadores, além de comparações com IIG,2014 e o próprio conhecimento da equipe envolvida no desenvolvimento da ferramenta, composta basicamente de indicadores indiretos de inovação baseados no capital humano.
Conforme citado no artigo, diferentemente da PINTEC, que é um questionário, o modelo proposto pelos autores “pretende identificar possíveis potenciais existentes nas ICTs que tenham possibilidade de desenvolver, em cooperação, inovações que possam ser incorporadas pelo mercado”.
Para isso, os autores estabeleceram indicadores multidimensionais que podem, segundo eles, “mensurar, por meio de um modelo indireto, uma representação aproximada dos potenciais de inovação” da organização.
Geralmente, defendem os autores, os indicadores de CT&I individuais não são expressos em termos monetários, mas são medidos em número de patentes, citações de artigos, etc. E a comparação destas “métricas” é dúbia.
No modelo proposto por eles, os indicadores de inovação “possibilitam uma comparação entre pesquisadores de uma mesma ICT, de um mesmo sistema regional de inovação, que pode ser coordenado por uma grande rede nacional, de tal forma que possibilitará identificar os potenciais pesquisadores com maior perfil inovador em cada uma das áreas de atuação”.
Com a aplicação do modelo proposto, argumentam os autores do artigo, “em um dado contexto será possível, por exemplo, identificar um pesquisador de biotecnologia que tenha maior potencial de inovação, que possa trabalhar em rede com outros pesquisadores existentes no sistema regional de inovação com o mesmo potencial de inovação. Esta configuração facilitaria o fluxo de conhecimento entre os pesquisadores, criando uma rede de ativos de conhecimento que, no somatório de suas competências, seria capaz de desenvolver inovações em um prazo mais curto de tempo.”
No modelo proposto pelos autores, foram estabelecidos três pilares de entrada com seus respectivos pesos, a saber: Capital Humano & Pesquisa; Aplicação de Conhecimento Sofisticado; Conhecimento Tecnológico, conforme pode ser observado na tabela a seguir:
potencial-de-inovacao-imagem1
potencial-de-inovacao-imagem2
potencial-de-inovacao-imagem3

O resultado da aplicação deste modelo é um índice que classifica o pesquisador analisado.
Com base neste modelo e utilizando as informações gerenciadas pela Plataforma Stela Experta® é possível “comparar os pesquisadores da ICT e, assim, potencializar e desenvolver estratégias para a gestão dos ativos de conhecimento existentes na ICT” e que quando aplicada em um sistema regional de inovação, “possibilita a gestão dos ativos de conhecimento, potencializando o desenvolvimento de uma rede integrada de capital humano com potencial inovador”.
Importante observar que o modelo apresentado pelos autores, baseado nos recursos humanos/capital humano, não leva em conta a infraestrutura das ICTs, os valores captados para estruturação de laboratórios ou outros fatores relacionados.
Segundo a análise dos autores deste estudo, talvez a maior vantagem do modelo estabelecido e proposto “seja o fato que o pesquisador não precisa preencher nenhum survey (questionário), nem a instituição precisa desenvolver um novo formulário, pois já encontra disponível a identificação dos principais recursos humanos, com melhores indicadores indiretos de inovação”.
Assim, a análise de potencial de inovação torna-se “uma atividade mais simples, além de possibilitar o desenvolvimento de uma gestão estratégica destes ativos de conhecimento existentes nas ICTs”. Desta forma, argumentam os autores, esta atividade pode tornar-se um procedimento corriqueiro e pode apoiar, com frequência, a análise estratégica feita por agências de inovações, núcleos de inovações ou pró-reitoria correlata.
Uma outra vantagem da aplicação deste modelo citada pelos autores é a “introdução de uma prática sustentável de indução de redes de ativos de conhecimento, que fomentem o fluxo de conhecimento para potencializar a inovação”.
O modelo proposto para os indicadores do potencial de inovação deverá ser implementado em breve na Plataforma Stela Experta®, possibilitando aos tomadores de decisão das ICTs identificar, entre os pesquisadores da sua instituição, os que possuem maior potencial de inovação segundo os fatores apresentados no modelo proposto no artigo e o índice atribuído a cada pesquisador analisado.
Publicado originalmente em: http://site.stelaexperta.com.br/identificando-o-potencial-de-inovacao-dos-pesquisadores-a-partir-dos-dados-do-cv-lattes/

sexta-feira, 26 de janeiro de 2018

Excelência acadêmica requer custeio público

* Fernanda de Negri, Marcelo Knobel e Carlos Henrique de Brito Cruz

A crise fiscal dos Estados e da União e de várias universidades importantes tem suscitado um debate sobre modelos de financiamento da universidade e da pesquisa científica no País. O debate é bem-vindo, assim como a proposição de alternativas que possam impulsionar a formação de pessoas e a produção de conhecimento no Brasil.

Várias universidades de ponta pelo mundo, públicas ou privadas, têm fontes de receitas mais diversificadas (doações, fundos patrimoniais e mensalidades, entre outras) do que as universidades públicas brasileiras. Mesmo assim, quem mais paga pelos custos das grandes universidades do mundo, sejam elas públicas ou privadas, continua sendo o Estado.

Endowments são fundos patrimoniais, em geral provenientes de doações, comuns nas universidades norte-americanas. As receitas de tais fundos usualmente cobrem algo como 5% das despesas anuais. As mensalidades, por sua vez, também não são, por si sós, a solução, pelo menos não para universidades de pesquisa. No Massachusetts Institute of Technology (MIT), por exemplo, elas equivalem a cerca de 10% das receitas.

O mesmo vale para recursos de pesquisa oriundos de empresas, que no MIT são cerca de 5% da receita anual. Na Universidade Estadual de Campinas (Unicamp) têm ficado próximos de 3% nos últimos anos. Nenhuma diferença abissal aqui.

As melhores universidades do mundo, além do ensino, produzem pesquisa de alta qualidade e impacto, com benefícios sociais e econômicos acima de seus custos. Por isso o Estado é um dos seus principais financiadores. No MIT, os contratos de pesquisa e subvenções do governo norte-americano são a principal fonte de receitas da instituição: 67% do total para pesquisa no quinquênio 2011-2015. Em Oxford, cerca de 50% das receitas vêm do governo. Na Alemanha, onde as universidades são, em sua maioria, públicas, esse porcentual é ainda maior. Na Universidade Tecnológica de Munique, por exemplo, mais de 60% das receitas correntes são provenientes do governo.

Quando se fala no financiamento da pesquisa, o papel do Estado é ainda maior. Na Inglaterra, estima-se que 66% dos recursos de pesquisa das universidades sejam provenientes diretamente do governo inglês e outros 11%, indiretamente, venham da União Europeia.

No Brasil, as fontes de receitas não são tão diversificadas como em outros países. E também é verdade que nossas melhores instituições custam relativamente pouco ao Estado brasileiro. Uma comparação entre a Unicamp e o MIT, duas universidades de excelência em seus países e com grande vocação para a produção de tecnologia, evidencia esse fato. A Unicamp tem, somando repasses do governo do Estado e receitas extraorçamentárias, uma receita anual, em paridade do poder de compra, de cerca de US$ 1,1 bilhão, menos da metade da do MIT.

Acontece que o MIT possui 4.500 estudantes de graduação e 6.800 de pós-graduação, enquanto a Unicamp tem 19 mil alunos de graduação e 16.600 estudantes de pós-graduação. A Unesp tem 35000 alunos de graduação e 11000 de Pós-graduação. O número de professores na Unicamp, por sua vez, é praticamente igual, pouco menos de 1.900 docentes nas duas instituições, e o número de funcionários técnico-administrativos é um pouco superior no MIT. A Unicamp tem mais que o triplo dos estudantes, com metade do orçamento e o mesmo número de funcionários e professores, sendo um dos mais importantes centros de pesquisa no País. A Unesp tem 3500 docentes (relação próxima de 1 docente para 10 alunos) a relação da Unicamp é próxima a da Unesp e no MIT é de 1 docente para cada 2 alunos. (dados da Unesp foram inseridos no texto original).

O volume de recursos que o MIT recebe a mais do que a Unicamp é, provavelmente, o que faz a instituição norte-americana ser uma das melhores universidades do mundo. Esses recursos são investidos em novos centros de pesquisa, laboratórios e equipamentos e na contratação temporária de pesquisadores. Os pesquisadores estagiários de pós-doutorado no MIT são mais de 5 mil, enquanto na Unicamp são apenas 270. Esses profissionais são definitivos para fazer a máquina de pesquisa do MIT funcionar tão bem. Ainda assim, a Unicamp é a universidade brasileira com o maior número de patentes solicitadas ao Instituto Nacional da Propriedade Industrial (Inpi).

Pesquisa científica é essencial não apenas para estimular a inovação e o crescimento econômico, mas também para resolver questões críticas do nosso desenvolvimento. Novas vacinas e novos tratamentos para doenças que afetam a população brasileira, tecnologias capazes de ampliar a produtividade agrícola e industrial, conhecimento capaz de mitigar os efeitos do aquecimento global sobre a nossa produção agropecuária são alguns dos exemplos. E é o Estado o grande financiador da ciência no mundo todo. Já a inovação exige investimentos empresariais.

As boas universidades no Brasil estão cada vez mais abertas às demandas da sociedade, incluídas aí as empresas. Precisam, além disso, buscar alternativas de financiamento e demonstrar transparência e visibilidade sobre os custos e resultados. Também precisam estar atentas às necessidades de uma das sociedades mais desiguais do mundo. Afinal, é o conjunto da sociedade que define, e assim deve ser numa democracia, os recursos que serão alocados para o ensino superior e a pesquisa científica.

As boas universidades no Brasil precisam e podem mostrar à sociedade que custam pouco, considerando sua qualidade e seus resultados. Precisam modernizar a gestão do orçamento, criando mecanismos internos de controle que permitam que as decisões sejam compartilhadas, transparentes e consistentes com nossa realidade econômica, demonstrando à sociedade os custos e impactos. E o Brasil precisa definir quantas boas universidades intensivas em pesquisa e ensino consegue manter em condições competitivas internacionalmente, considerando que caro mesmo para um país é não saber criar conhecimento.

* RESPECTIVAMENTE, TÉCNICA DO INSTITUTO DE PESQUISA ECONÔMICA APLICADA (IPEA), REITOR DA UNICAMP E DIRETOR CIENTÍFICO DA FAPESP

Originalmente publicado em 5 de janeiro de 2018, O Estado de S. Paulo, página 2, Espaço Aberto

Eqseed

Novas modalidades de capital de risco estão surgindo no Brasil. Um bom exemplo é a Eqseed que gerencia porfolio de investimentos e permite que pequenos investidores acessem empresas de tecnologia.

quarta-feira, 24 de janeiro de 2018

InSysPo - 6 e 7 de junho na Unicamp

INTERNATIONAL SYMPOSIUM - Innovation Ecosystems, Upgrading, and Regional Development - (UNICAMP) - June 6-7, 2018

Premilinary program - soon more information

segunda-feira, 22 de janeiro de 2018

As universidades mais inovadoras do mundo em 2017

O texto obviamente tem problemas, quem inova afinal são as empresas, mas esquecido isso os rankings são importantes para entender o que estas instituições fazem de tão especial e o que estamos deixando de fazer.
Texto publicado originalmente em: http://epocanegocios.globo.com/Carreira/noticia/2017/11/universidades-mais-inovadoras-do-mundo-em-2017.html
___
O top 100, por sua vez, é composto de 51 universidades com sede na América do Norte, 26 na Europa, 20 na Ásia e 3 no Oriente Médio. O Brasil não tem nenhum representante na lista. Confira as 30 primeiras colocadas:

1. Stanford University
2. Massachusetts Institute of Technology (MIT)
3. Harvard University
4. University of Pennsylvania
5. KU Leuven
6. KAIST
7. University of Washington
8. University of Michigan System
9. University of Texas System
10. Vanderbilt University
11. Duke University
12. University of California System
13. Northwestern University
14. Pohang University of Science & Technology (POSTECH)
15. Imperial College London
16. Cornell University
17. California Institute of Technology
18. University of Wisconsin System
19. Federal Polytechnic School of Lausanne
20. University of Southern California
21. University of Tokyo
22. Johns Hopkins University
23. Georgia Institute of Technology
24. Seoul National University
25. University of Illinois System
26. University of Cambridge
27. Indiana University System
28. Pierre & Marie Curie University - Paris 6
29. University of Colorado System
30. University of Pittsburgh